
Grid cell details
You can show the details for each grid cell in the pie chart display and can configure the cell as needed.
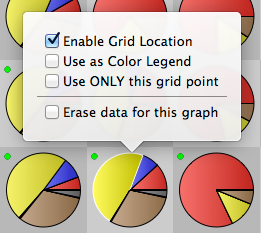
To configure a grid cell:
- Control-click the grid cell.
- Select options, and then click anywhere outside the window to dismiss the popover and implement the choice(s).
- Enable Grid Location - Checked by default. Include this cell when calculating the grid.
- Use as Color Legend - Use the phase abundances from this cell to assign the phase color palette for the entire grid.
- Use ONLY this grid point - Unchecked by default. Include only this cell when calculating the grid.
- Erase data for this graph - Erase results for this grid cell and blank the grid display. (Useful for forcing exclusion of a grid cell in Contour or Phase Diagram graph overlays.)
To show a grid cell's details:
◆ Click the grid cell.
A popover with details appears.
A - Title
- Grid cell conditions
B - Status message
- Convergence criteria. Irrecoverable error messages are displayed here, and are also indicated by a visual dimming of the problematic grid cell and a red status indicator. See Status messages for advice on dealing with abnormal termination behavior.
C - Pie chart display
- Click any phase in the system phase list to identify the pie wedge for that phase.
D - Phases in the system panel
- Phases present in the system are listed in order of abundance, reported in grams. Potential phases are ordered by their chemical affinity for saturation (identified by numbers in parentheses, recorded in Joules). The smaller the chemical affinity, the closer a phase is to saturation. Affinities of "(0.00)" indicate that the quantity could not be accurately estimated by the phase saturation algorithm. Formulas of the phases are displayed in the last column. Note that the table scrolls both vertically and horizontally.
E - Calculation status indicators
- Green indicates a successful calculation.
- Yellow indicates a possible problem.
- Red indicates an error.
- Blue indicates negative pressure and a calculation that is physically impossible. See Advanced features.
- View the grid cell's status message for more information.
- To hide status indicators, see User preferences.
F - Intensive variables and phases present
- Click an entry to drill down and discover information.
G - Print
- Click to print a graphical representation of the popover. See also Print and export.
